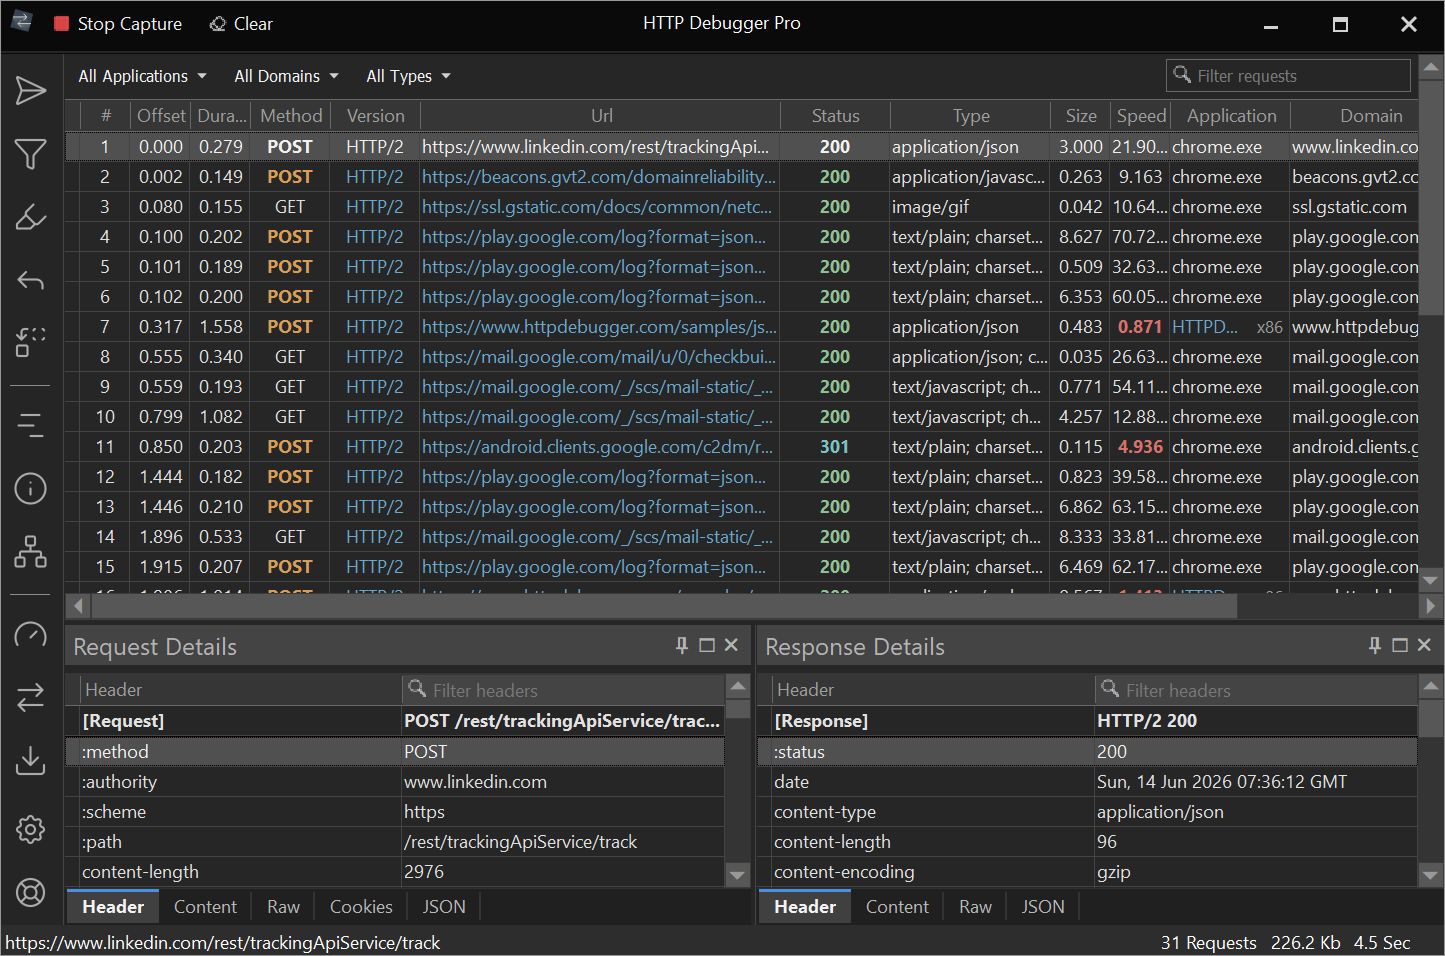
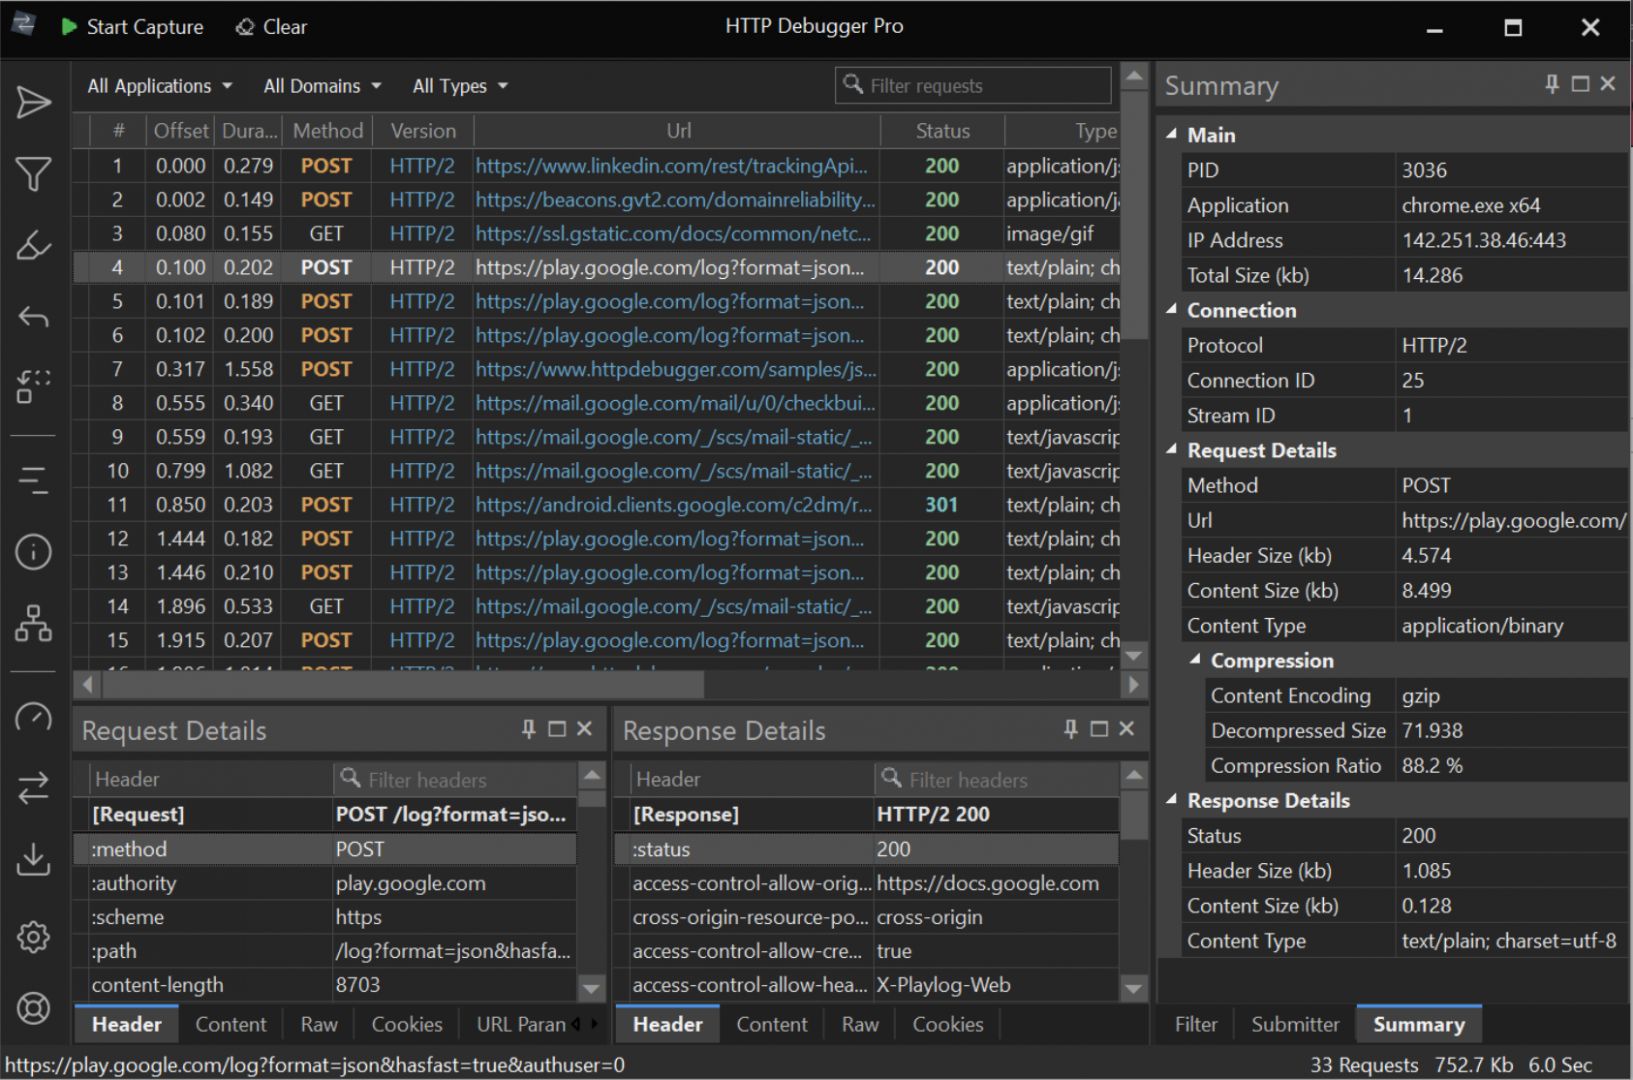
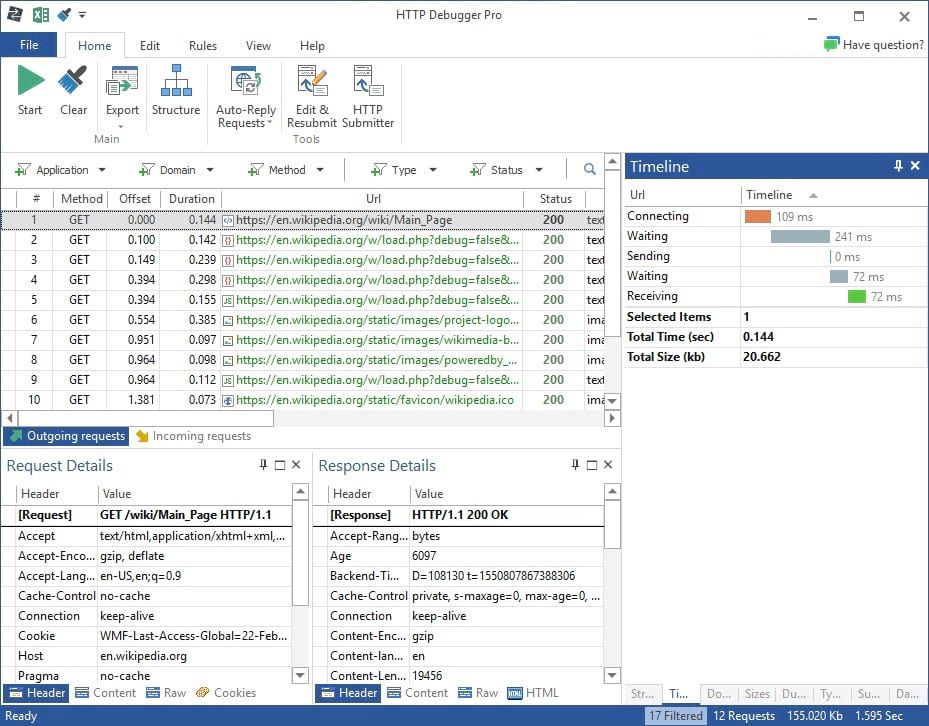
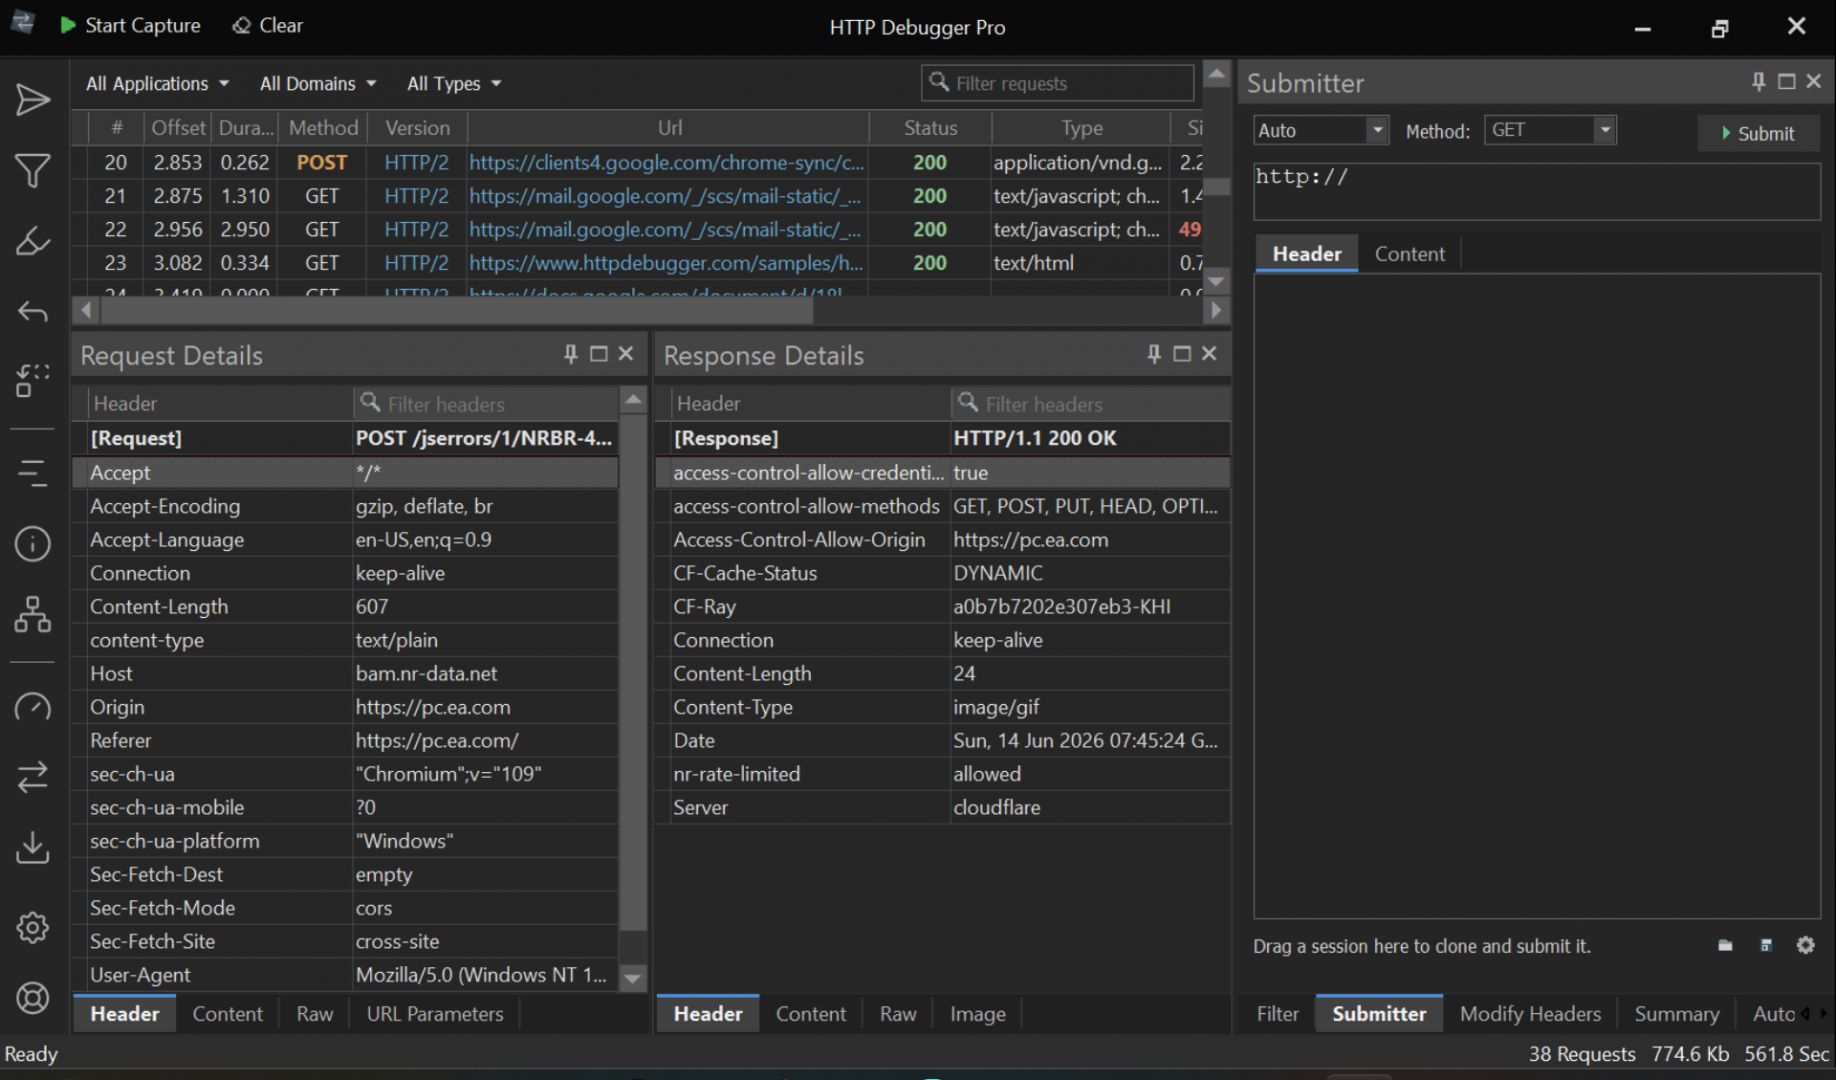
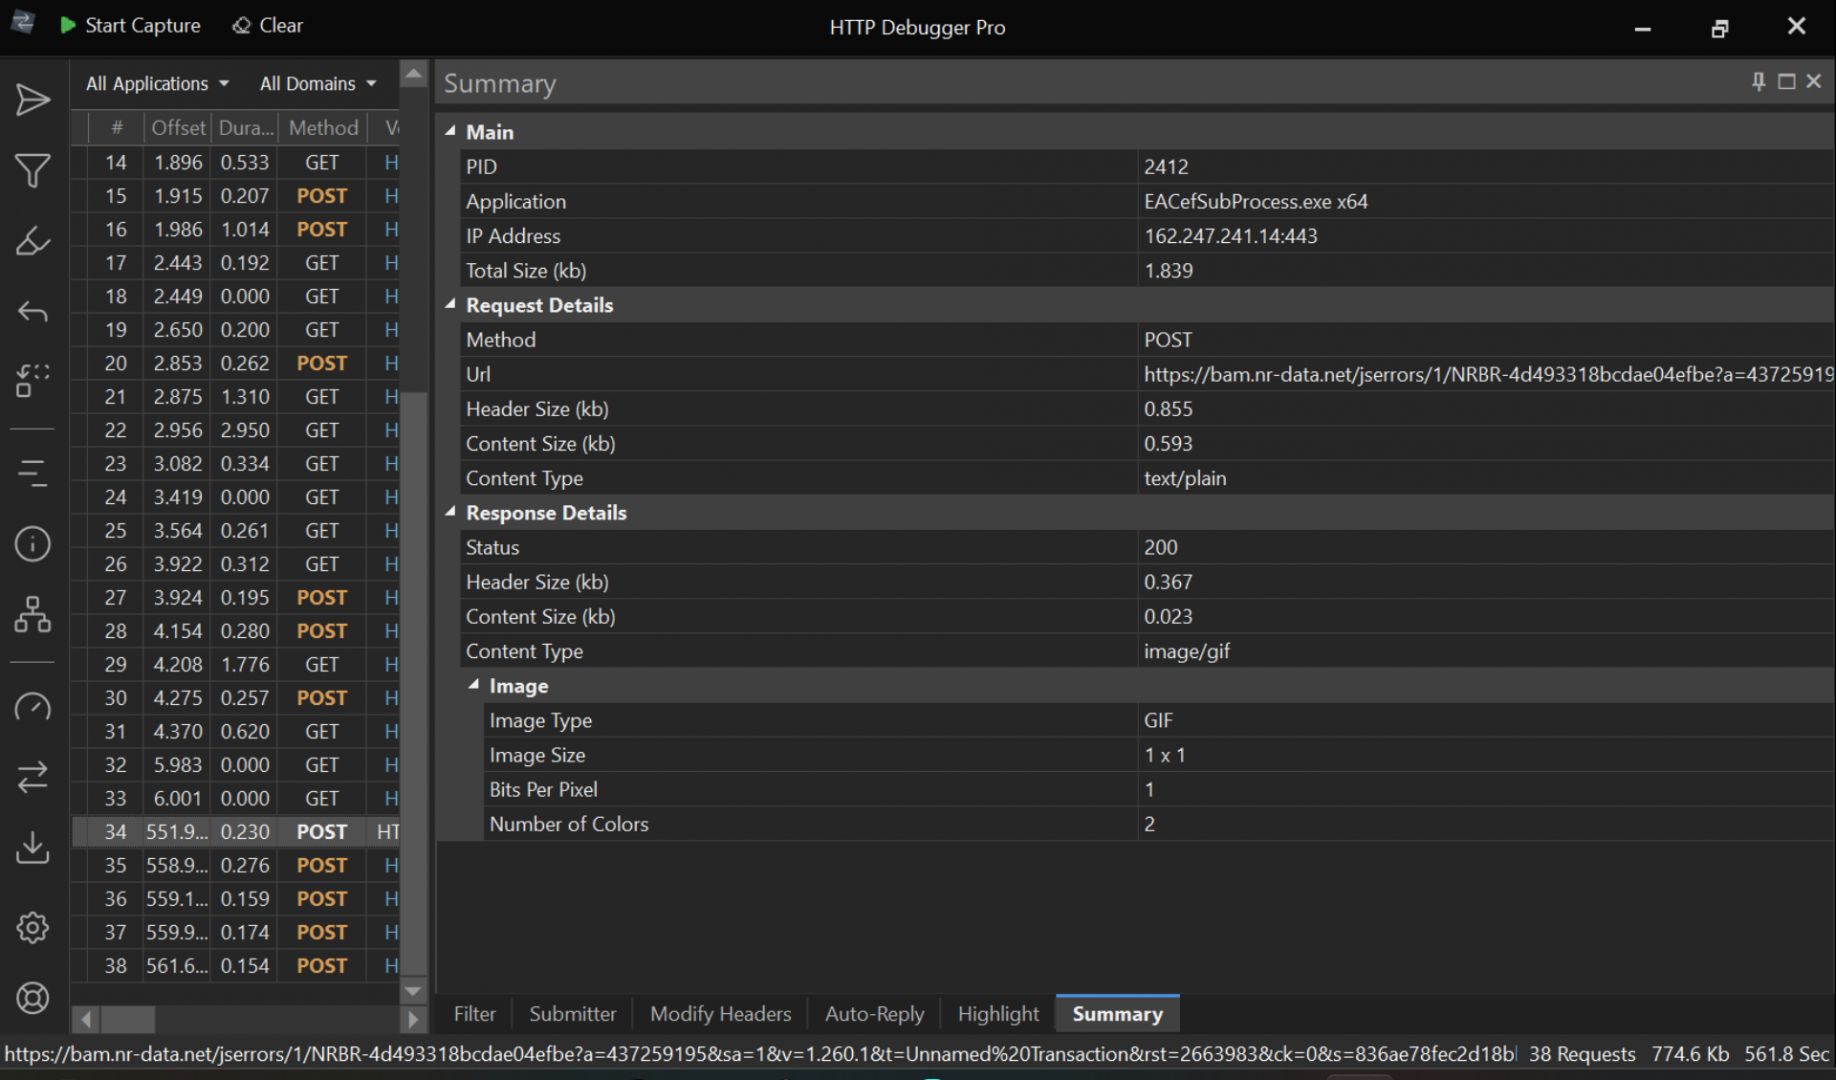
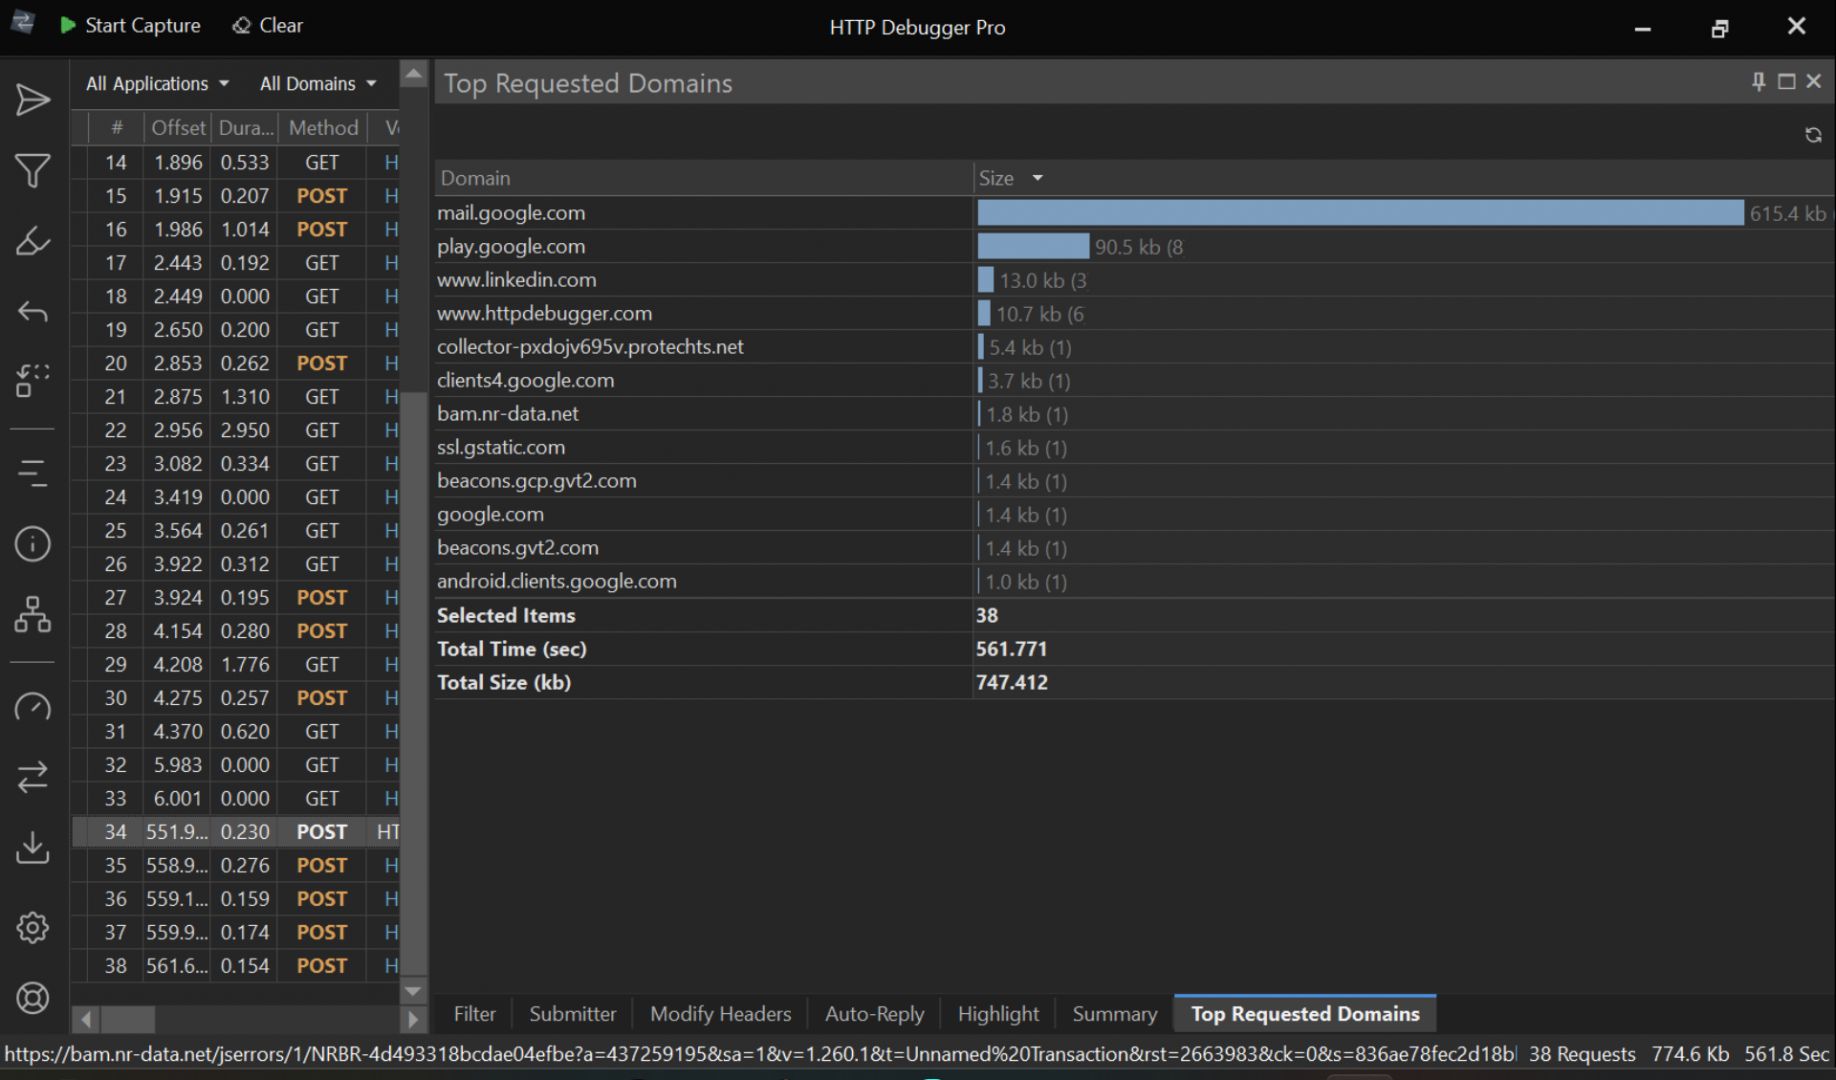
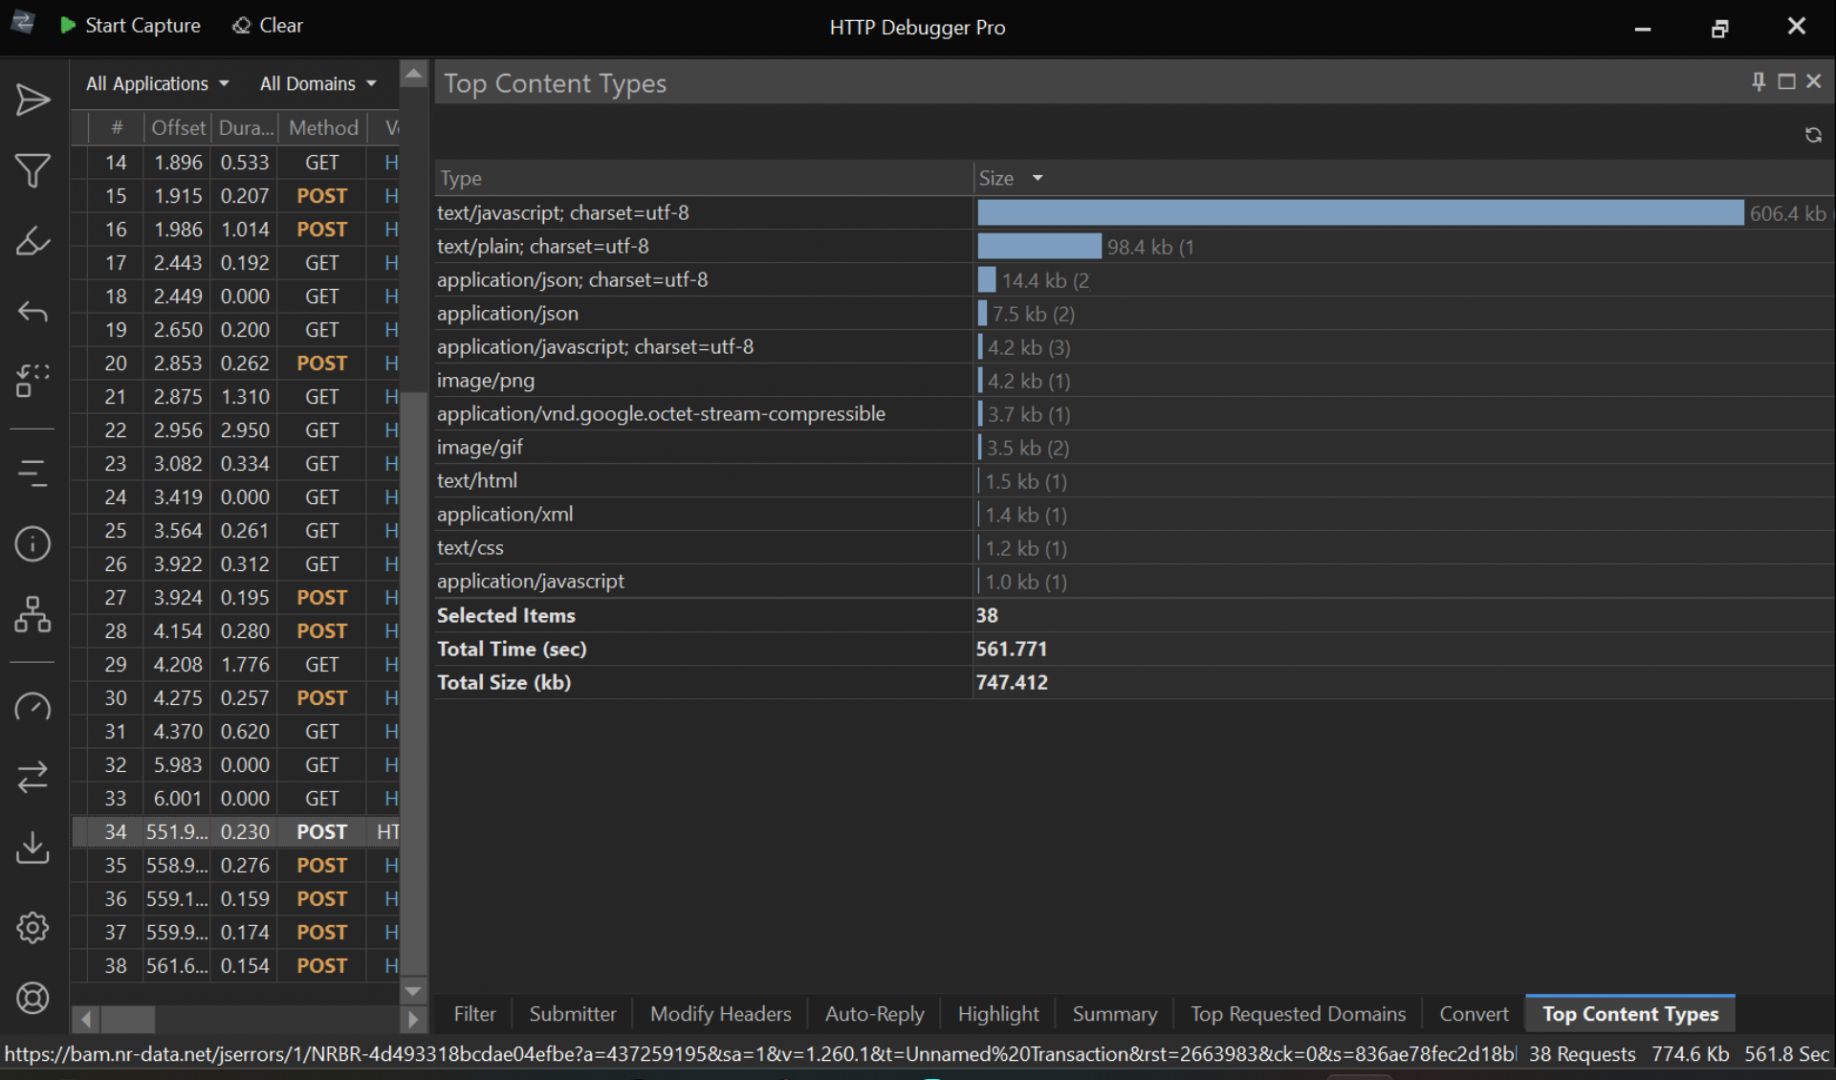
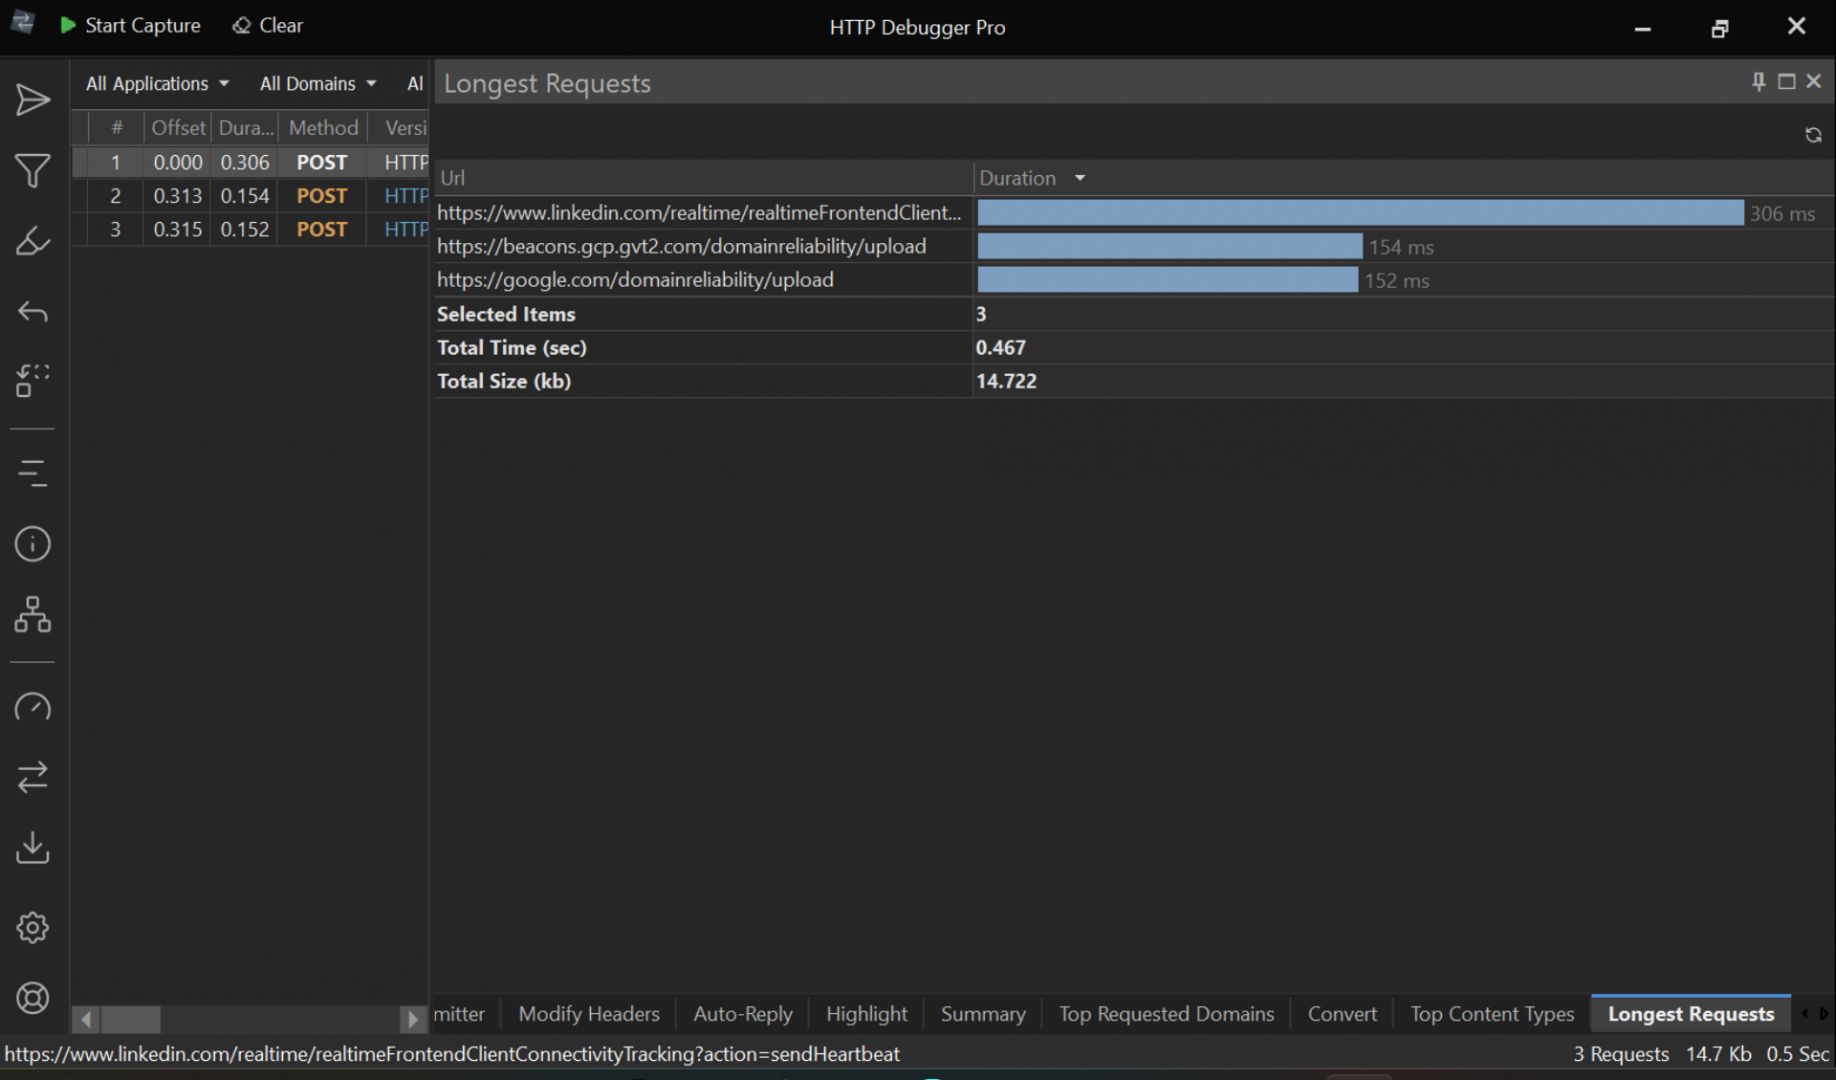
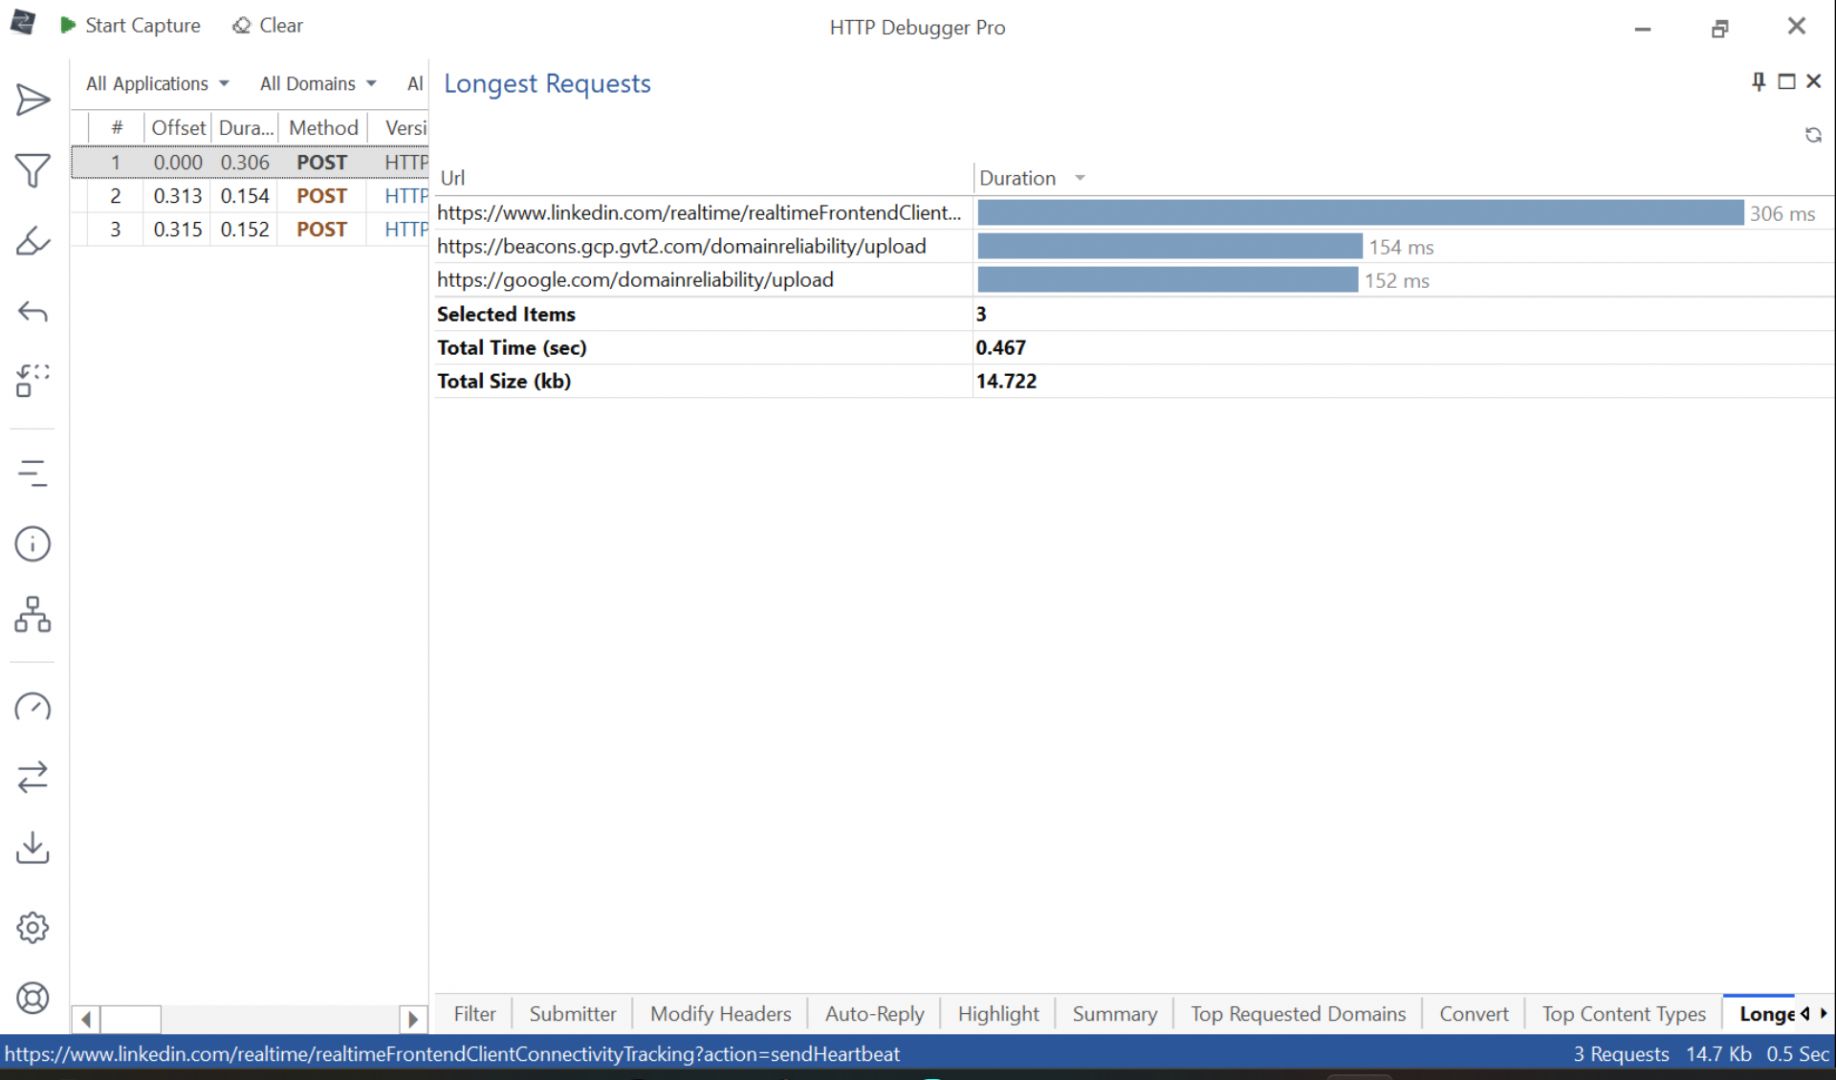
HTTP Debugger is a network monitoring tool that allows users to capture, inspect, analyze, and debug HTTP and HTTPS traffic between applications, web servers, and their PCs. It is a premium Windows application that is primarily for developers, testers, IT professionals, and API testers. It provides detailed visibility into APIs, web requests, and responses, and helps you analyze web application behavior.
Unlike many other debugging tools, HTTP Debugger does not act as an HTTP proxy. Instead, it intercepts traffic at the network stack level, meaning it can capture requests from complex applications that do not respect proxy settings. It then presents all the web requests and responses in an organized interface for you to see, analyze, and examine. Whether you want to check out what data is being passed on when you allow cookies on a website or want to examine requests, this is very helpful.
Traffic capture and request analysis
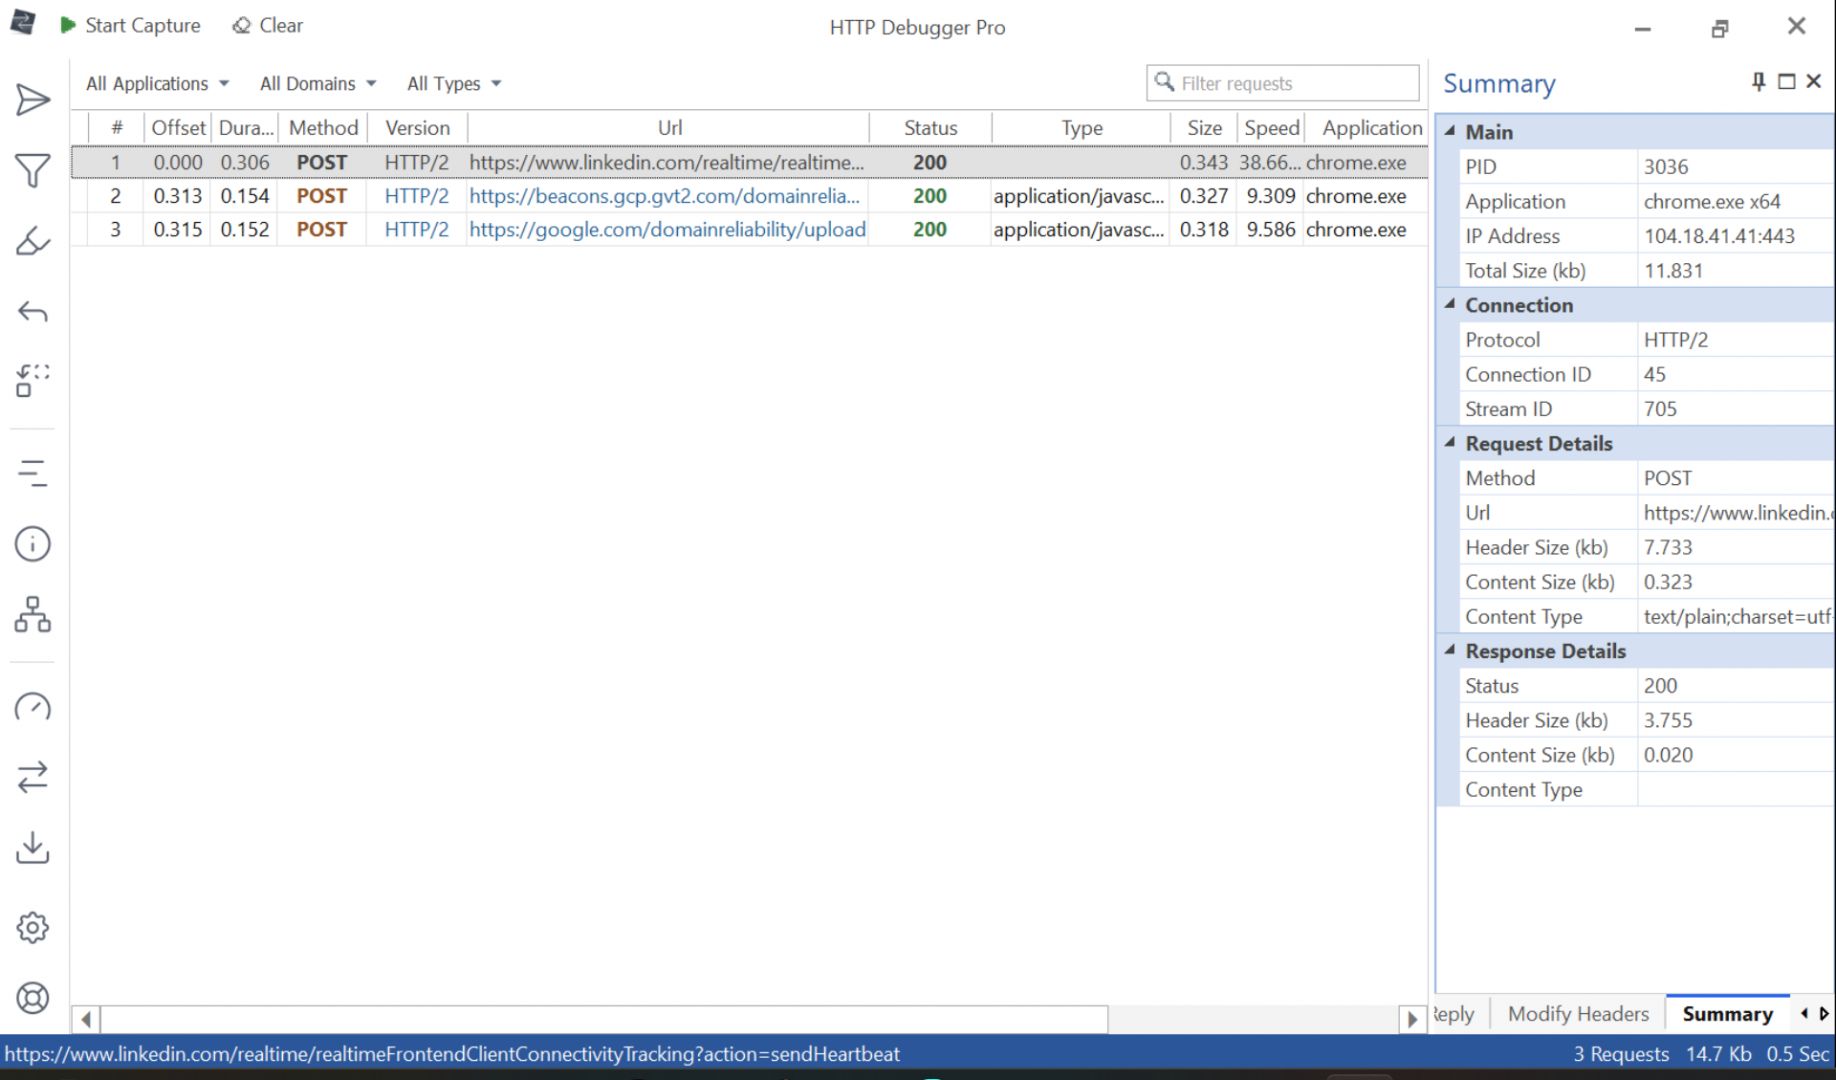
HTTP Debugger’s main function is to capture and display HTTP/HTTPS communications in an organized manner. Once you have installed and run the capturing process, the application will record traffic until it is stopped. It will capture all traffic generated by browsers, desktop apps, and other software that may be interacting with the internet.
You can then inspect various components such as:
- Request and response headers
- Cookies and session information
- Query strings and POST data
If you are a tester or a developer working with web requests, this detailed information will help you verify problems within your webhooks or see errors such as failed authentication or other API errors. The ability to examine traffic at a granular level makes the software particularly useful during development and troubleshooting workflows.
HTTPS inspection and debugging tools
Modern websites and applications rely heavily on encrypted HTTPS traffic, making HTTPS inspection an important feature for debugging tools. HTTP Debugger supports HTTPS traffic analysis by decrypting and displaying secure communications for inspection.
This allows users to view request and response contents that would otherwise be hidden by encryption. For developers testing APIs or troubleshooting web applications, this functionality can significantly simplify the debugging process. The software also includes filtering capabilities that help users focus on specific requests rather than sorting through large volumes of network activity.
Monitoring, filtering, and diagnostics
While traffic capture and displaying detailed requests are the main functions, HTTP Debugger provides tools for filtering and organizing recorded sessions. Sometimes, it will record too much information as it takes it from the browser, desktop apps, and any other processes interacting with the internet on your PC. You can search, sort, and isolate requests based on various criteria, allowing you to focus on the most relevant data.
A capable solution for inspecting web traffic and diagnosing network issues
HTTP Debugger is a comprehensive commercial tool for monitoring, inspecting, and analyzing HTTP and HTTPS requests to and from your PC. Its detailed traffic capture, inspection capabilities, and filtering tools make it handy for developers, testers, and networking professionals who work regularly with web apps, APIs, and web requests.